How to choose which baseball game to watch
If you like to watch or listen to baseball, and not just your home team, how do you choose from the as many as 15 games that happen most days? You could always look at a list of pitchers and teams and try to remember off hand who's doing well and is fun to watch, and click around to read previews occasionally, but that takes time.
Or, just take a look at the latest "What to watch" blog post and start at the top - the games are ranked by "watchability", based on a set of stats outlined below. Carson Cistulli came up with this idea when he was at FanGraphs, and it's a great one. Thank you, Mr. Cistulli.
I think he did things manually. My posts are automatic: every morning code runs that pulls the stats; calculates "NERD" scores for the starting pitchers, the teams, and the game overall; uses Claude or OpenAI (ed: as of 8/9) to generate a text summary of each game; and then creates and publishes a new blog post. The commentary is a far cry from his posts - he was funny - but the info is still useful enough to me that I look at the post most days.
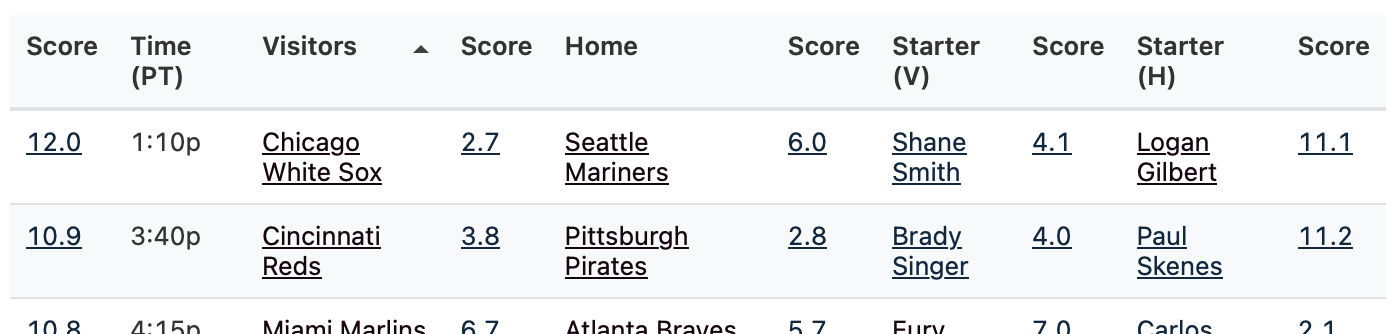
The table starts ordered by best overall score, as shown on the left. You can click each overall score, or scroll down, to get detailed stats and the text summary for each game; click the table headers to re-order the list by time, team score, or pitcher score; and click team and pitcher names to visit FanGraphs for more info.
What is "watchable"?
What makes for a high score? Things that are fun to watch, or not. Lights-out, hard-throwing pitchers are fun to watch. Teams with a lot of batters that hit the ball hard are fun to watch. Generally, I've followed the approach that Cistulli formed over multiple years, in some cases updating to stats that are more recent and that I can retrieve automatically. (The stats I'm using are a first cut - I haven't done a detailed analysis or review of every possible candidate stat, and I'll likely tweak things if/when I spend more time.)
Stat details
Pitcher scores use these stats:
- xFIP-: "Expected fielding-independent pitching" measures overall pitcher effectiveness. It's a better version of ERA, because it doesn't conflate pitcher skills with what happens after the ball is hit and when balls fall in or don't. It's adjusted for the pitcher's home park and league. An average score is 100, lower scores are better, like with ERA (hence the minus), and a single point means better or worse by that percent - an xFIP- of 95 is 5% better than league average. More info: xFIP and xFIP-.
- Swinging strike rate: How often the pitcher generates swings that miss. Higher is better.
- Strike rate: The proportion of pitches that are strikes. Higher is better.
- Fastball velocity: The velocity of the pitcher's four-seam fastball. Higher is better.
- Age: How young is the pitcher? Rookies are fun to watch. Lower is better.
- Pace: How long do we have to wait between pitches? Lower is better. (I think there's less variation in this number now because of the pitch clock, and the worst offenders are quicker, so perhaps I'll drop this component in the future.)
- "Luck": Is the pitcher underperforming and likely to improve, as measured by a traditional stat (ERA) compared to a stat that better correlates with future performance (xFIP)? Positive is better. The actual stat is ERA- minus xFIP-.
- Knuckleball rate: How often does the pitcher throw knuckleballs? Knuckleballs are fun to watch.
Team scores use these stats:
- Batting runs: This measures the overall at-the-plate abilities of the team. It's "weighted runs above average" (wRAA) with park adjustments (so we can compare the Seattle Mariners and the Colorado Rockies directly) and league adjustments, and is context-neutral (it depends on batter skill, not on things that are more random, like when a batter does certain things). Higher is better. More info: offense.
- Barrel rate: How often do batters on the team hit the ball hard? 'Hard' means the ball has a launch angle and exit velocity above certain thresholds that have typically led to hits and extra-base hits. Higher is better. More info: barrel rate.
- Baserunning runs: How much do batters contribute on the base paths, by stealing bases (and not getting caught), avoiding double plays, and advancing when the ball is in play? Higher is better. More info: BsR.
- Fielding runs: How much do players contribute with their gloves, compared to an average player fielding the same balls? Higher is better. More info: defense as well as UZR.
- Payroll: The team's payroll for the year. Lower is better. I couldn't find constantly updated payroll totals easily available for download (and payroll doesn't change much day-to-day anyway), so I just get this once for the year.
- Age: Average age of players on the team. Lower is better.
- Luck: Like with the pitcher luck component above, is the team underperforming and likely to improve, as measured by a traditional stat (actual runs scored) compared to a stat that better correlates with future performance (wRC)? Positive is better.
- (Added 8/14/25) Bullpen runs: How much does the bullpen contribute or take away from the team's overall performance? The raw stat I use here is FanGraph's 'RAR' (runs above replacement) number for the relievers on the team. In contrast to the other run stats, the number is 'above replacement' instead of 'above average' (because that's what FanGraphs provides for team data filtered to just relievers). But, as the contribution to tNERD is still just the z-score, the different baseline doesn't matter. The raw stat however does look higher than the other 'run' stats, because it's calculated from a 'replacement' player instead of an average player, and replacement players are worse than average.
- (Added 8/19/25) TV: A small bump up for better TV broadcasting teams, based on Awful Announcing's local broadcaster ratings. The contribution is the z-score of the rating from the site, capped on the low side at zero so only teams that are better than average see a change - teams with broadcasters that are worse than average stay at zero.
- (Added 9/18/25) Radio: Awful Announcing published radio broadcaster ratings, and I updated the generated page to show both TV and radio. The contribution to the tNERD score is now half of the z-score for each type of broadcast, so the overall contribution to tNERD stays roughly in the same range as it was before.
For most of the stats, I calculate the z-score - so a score that's equal to the average of all pitchers/teams is zero, a score of one is one standard deviation above the mean, etc. Then I (sometimes) multiply that z-score by a value to bump up or down the final contribution based on importance - for example, I multiple pitcher xFIP- by two. I cap some components, like age, payroll, and luck, so they're always between zero and a given value, like two.
The pitcher and team scores are just the sum of the individual component scores, and the overall game score is the mean of the team and pitcher scores. All of this matches Cistulli's approach oh so many years ago. You can see the details of the calculation for each team and pitcher in the focused tables further down the page.
Ideas
There are a lot of things that would be great to add - the following items are all part of my enjoyment of watching or listening to a game, and aren't in the score right now. For example:
- (Added 'TV' column on 8/19/25, and radio on 9/18/25)
How good are the broadcasters? RIP Vin Scully, who would get an automatic plus-a-lot for every game. - Does the park or broadcast itself make the game more fun to watch? Can I see the pitch type where the ball crosses the plate?
- (Added 'Bullpen runs' column on 8/14/25)
How good is the bullpen? This isn't included right now because the team stats are, currently, about offense, and the pitching scores are just about the starter. - Are there other stats that correlate to things that are fun to watch? There are a lot of new stats that weren't a thing when Cistulli started.
- Does the game matter for the post-season? (Empirically, playoff-involved teams tend to have better team scores and better pitchers, so some of this comes through already.)
Thanks Claude Code
(Finally, Claude Code is amazing. I could have written the code that does all of the above myself, but I've wanted this since Cistulli stopped posting ~10 years ago, and I've never made the time until now, when I wanted something to dig into to get hands-on experience creating with code agents. Claude Code blew my expectations out of the water. I'll write more about this at some point.)